Date and time filter
This page describes a design that is ahead of the code. Its parts exist in the product separately, but the combined dropdown does not ship yet. There is no Storybook story for it.
Use the time filter to scope data by time across the product: errors, performance, dashboards, uptime and more. The default selection is Last 24 hours.
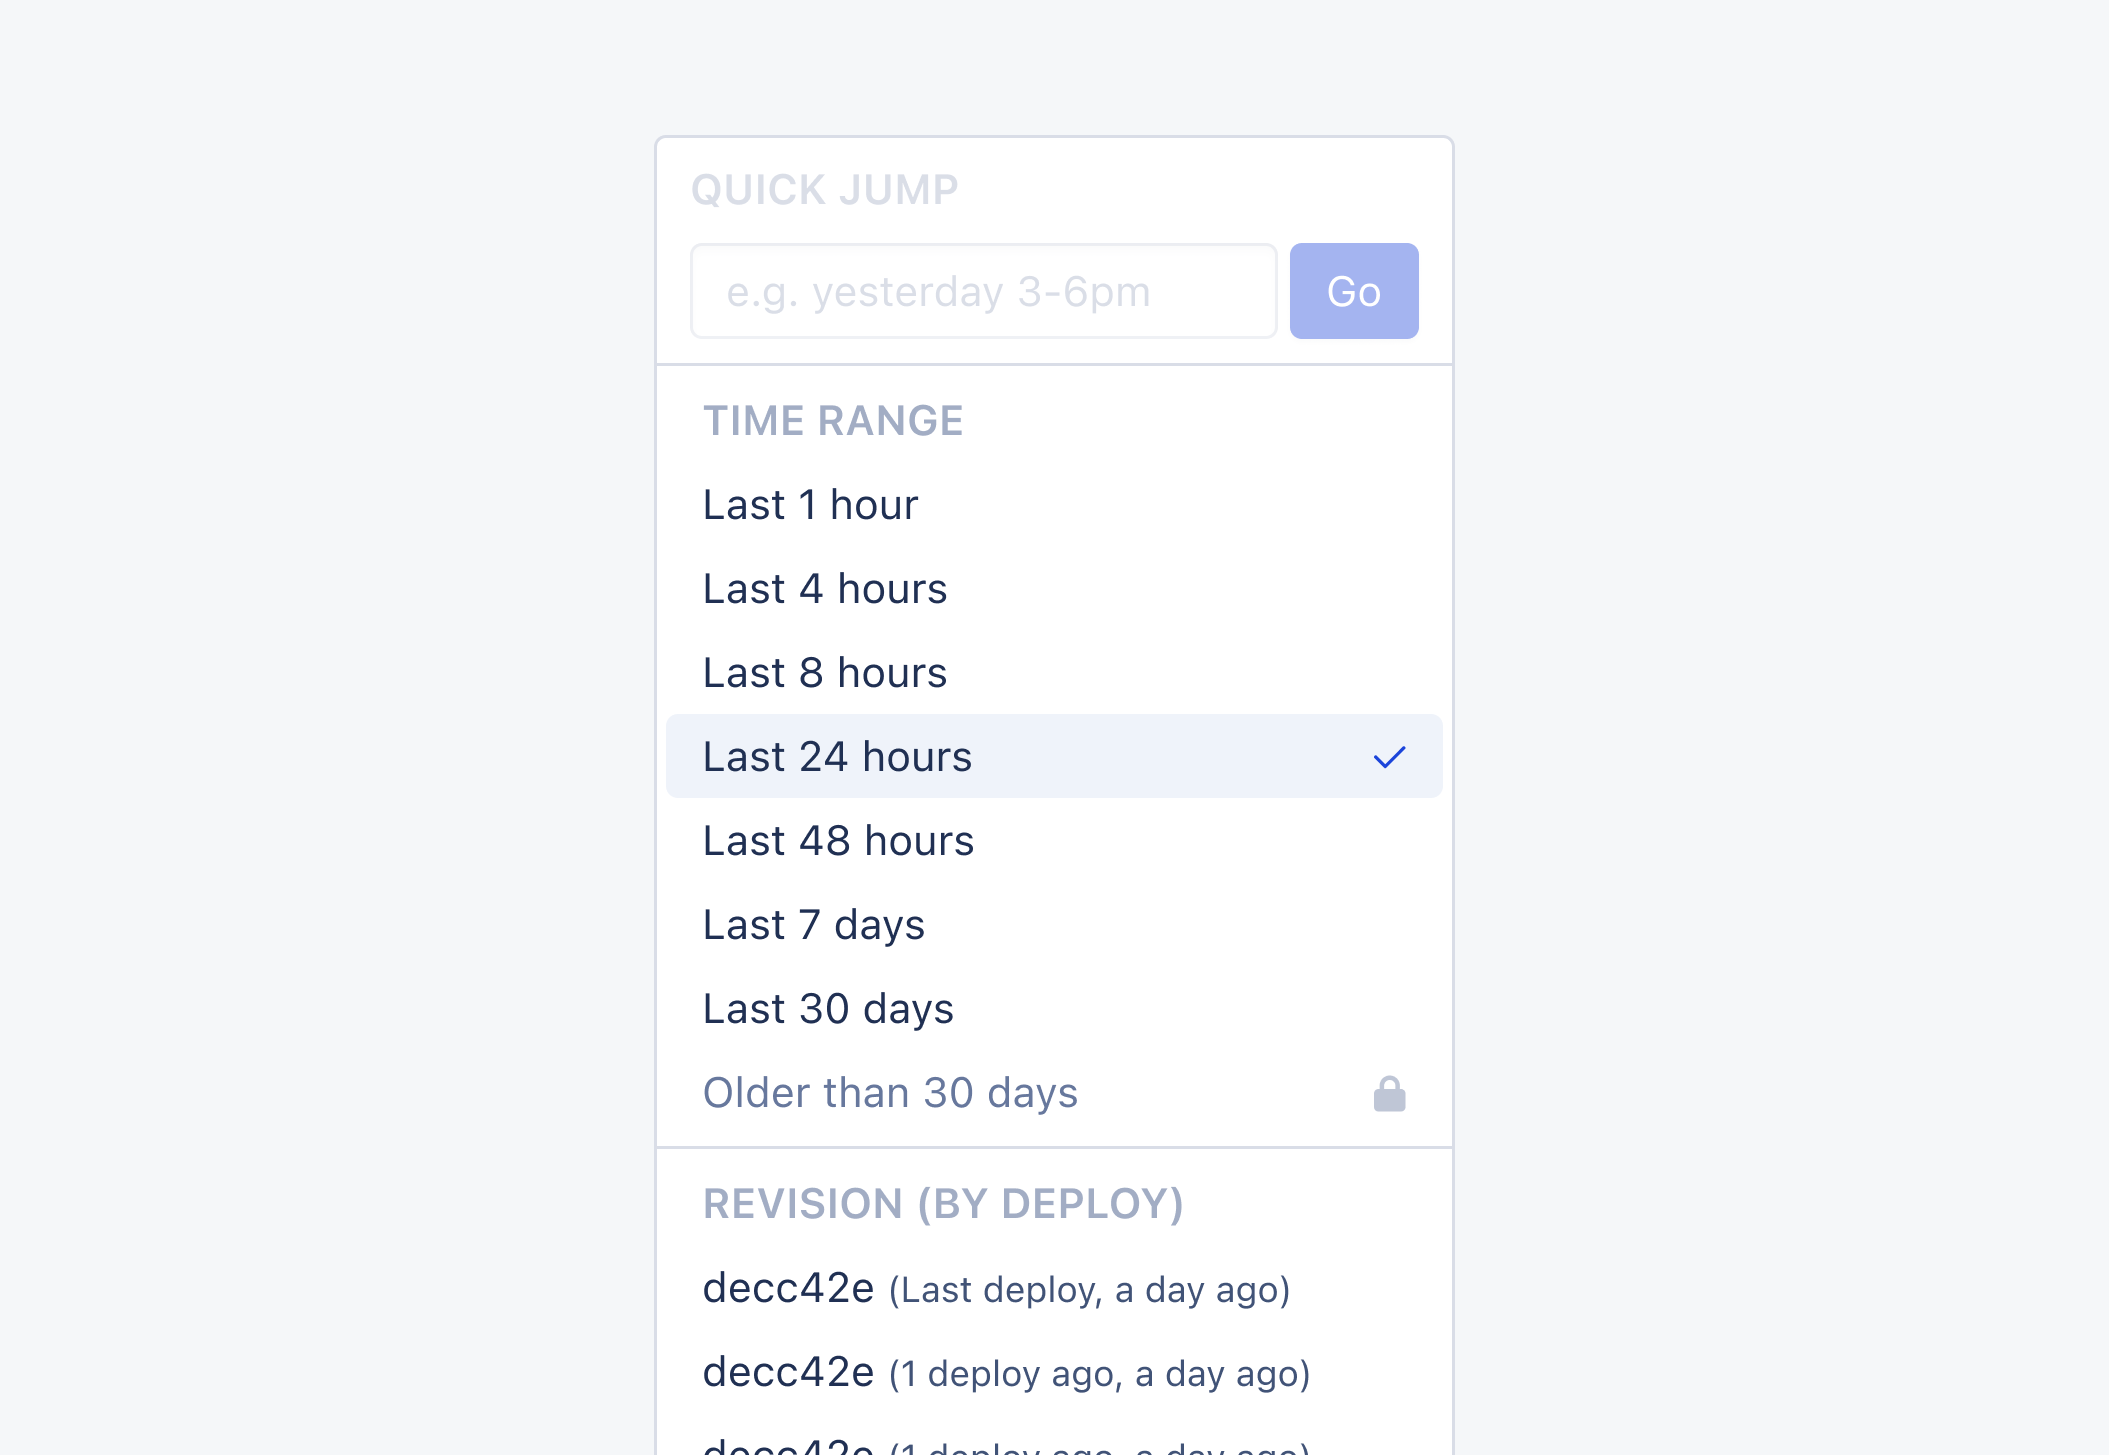
Sections
The dropdown has four sections. A page can include or leave out each one.
Quick jump
A text input for time queries in natural language, such as "yesterday 3-6pm". It is not active in the product yet: the section is hidden and will be enabled in a later release. The input is NaturalLanguageDateRangeInput.
Time range
Preset relative ranges: Last 1 hour, Last 4 hours, Last 8 hours, Last 24 hours, Last 48 hours, Last 7 days and Last 30 days. Only one can be active at a time, and the active option shows a checkmark.
Revision, by deploy
Recent deploy revisions, listed by short commit hash with a relative timestamp, such as "Last deploy, a day ago". The list ends with an "All in the last 60 days" option. Use this section on pages where readers compare behaviour across deploys. It exists in the product today as DeploysFilter.
Custom range
Expands into FROM and TO inputs, each with a date (dd/mm/yyyy) and a time (00:00), and an "Apply range" button. While a custom range is selected, the Time range and Revision sections are disabled.
Composing the sections
Not every page needs every section. Include only the sections that fit the page's context. A section that is left out is not rendered at all, so there is no empty gap and no stray divider.