Trace timeline
The trace timeline shows where a single request, a trace, spends its time as it moves through many spans. Spans are stacked into a parent–child tree, and each span's start offset and duration are drawn as a horizontal bar. Bottlenecks, ordering and nesting can then be read at a glance.
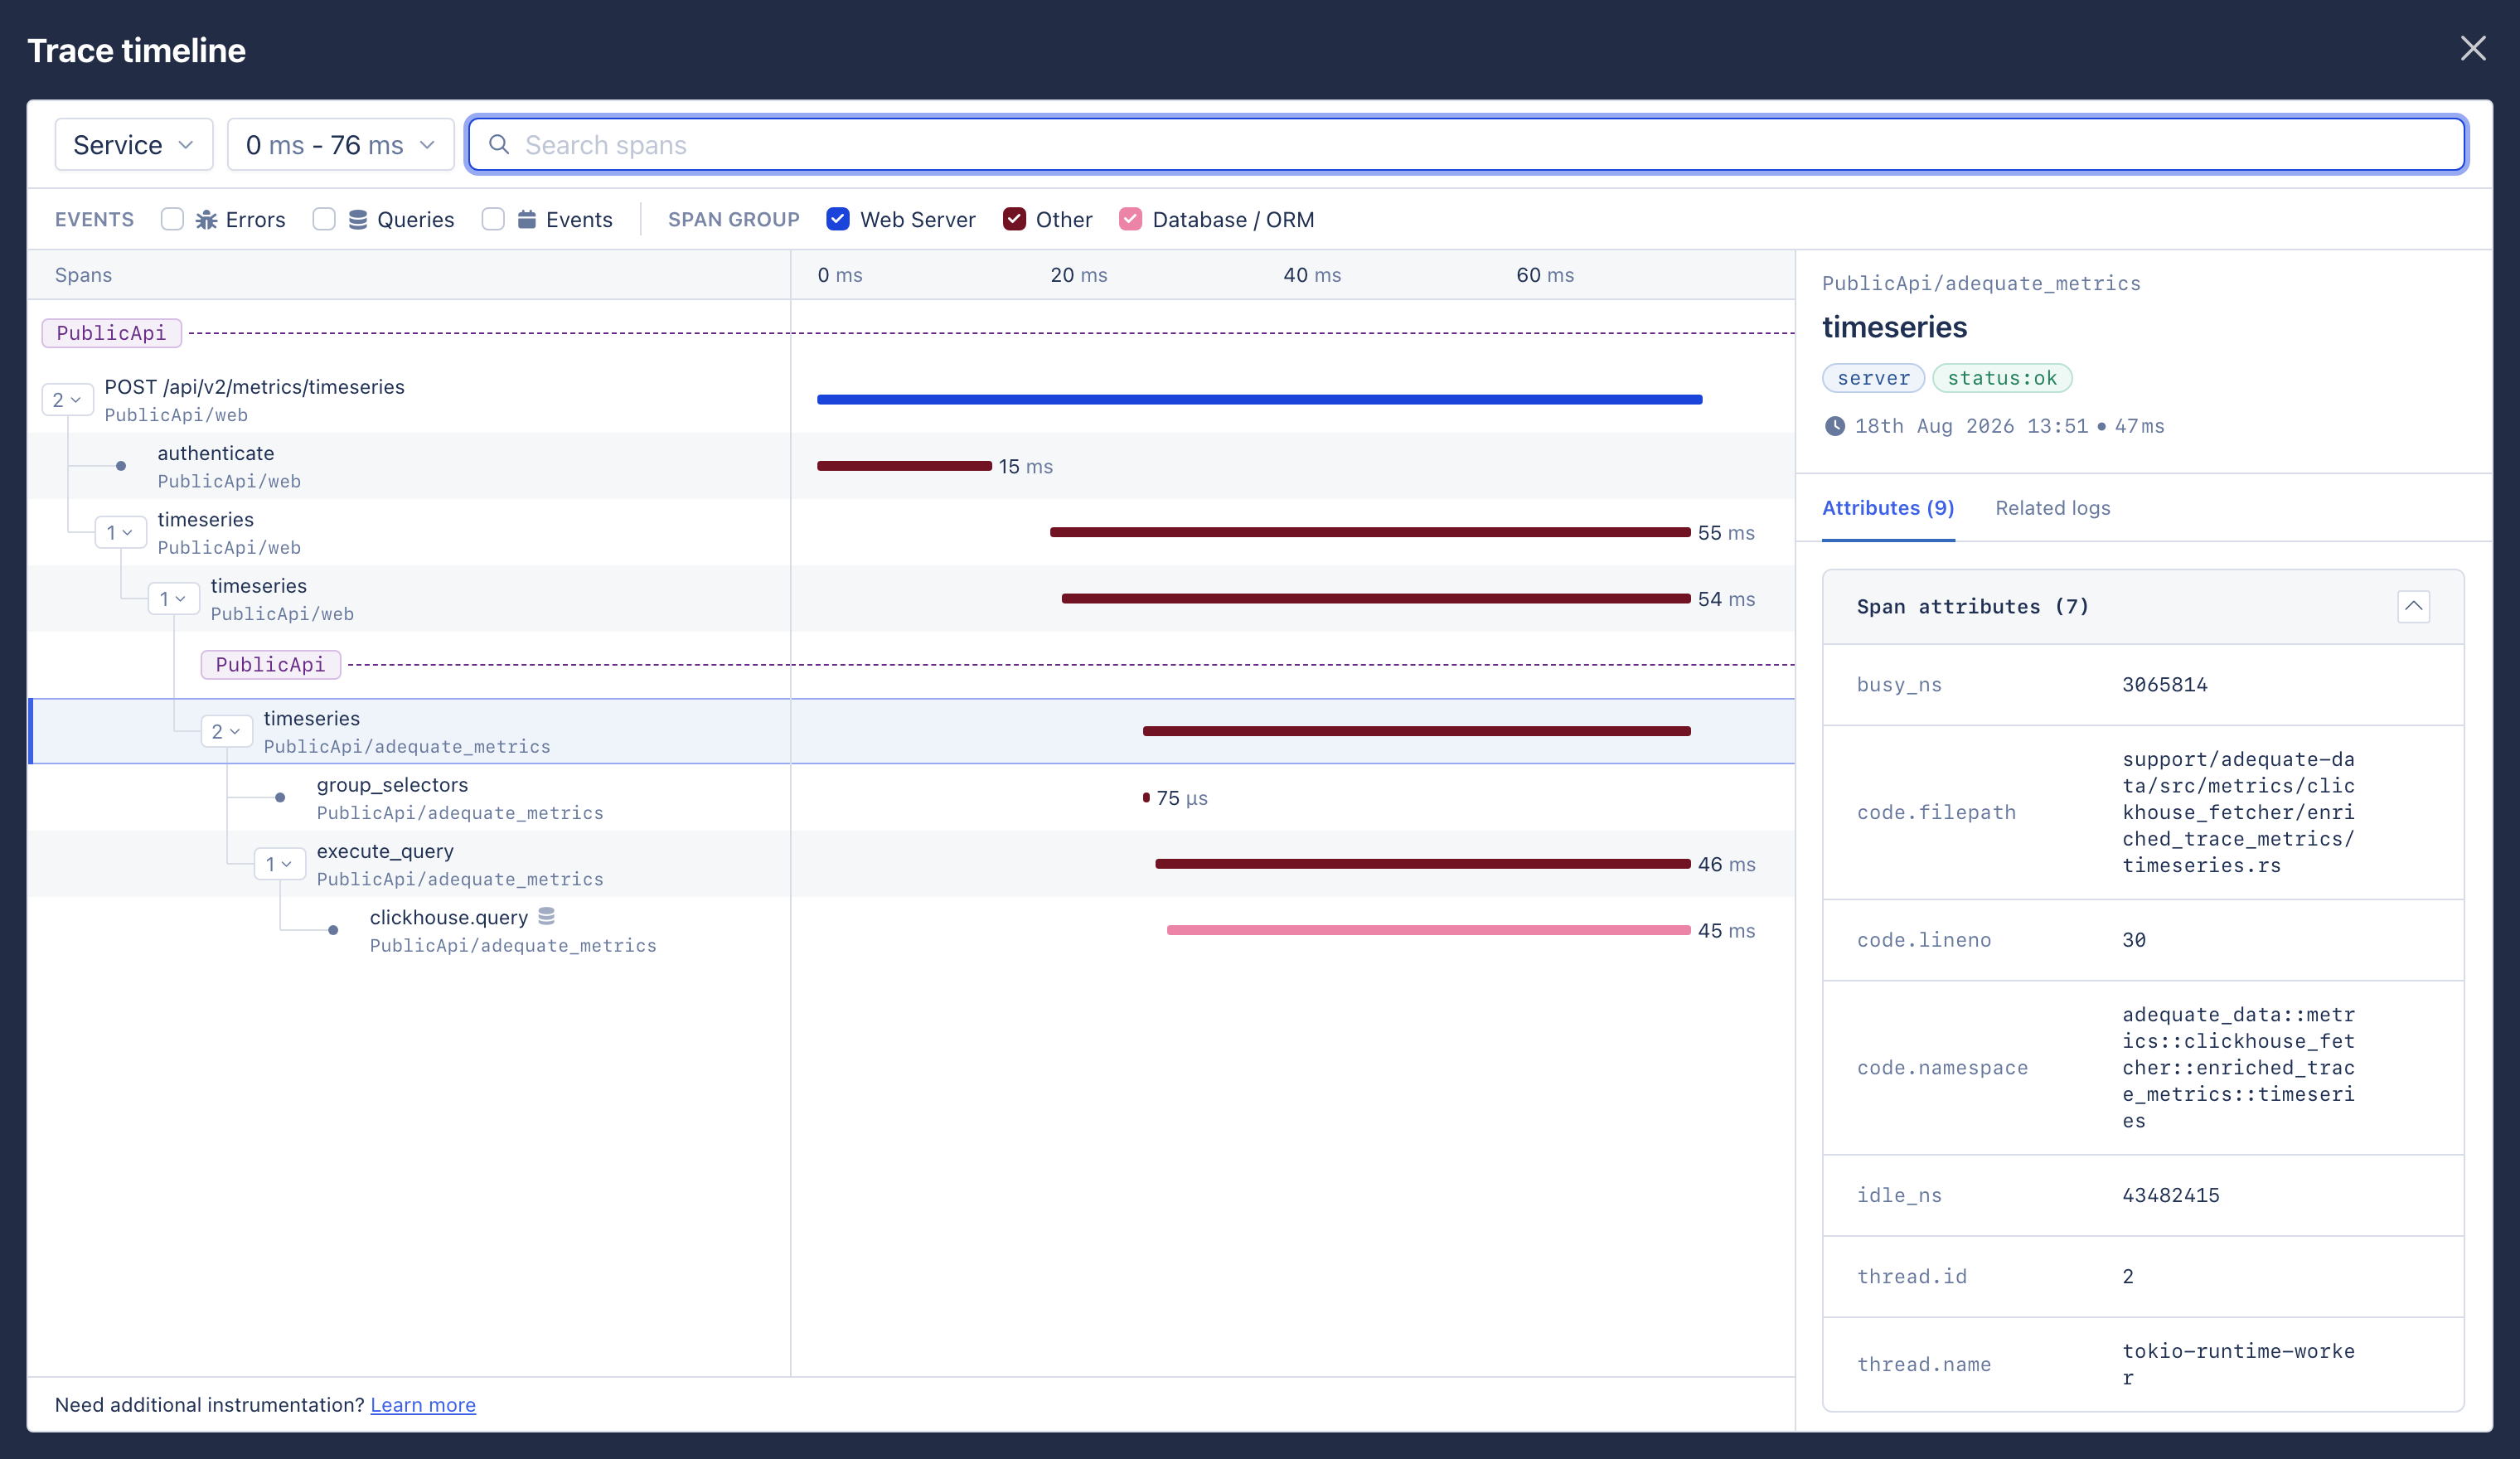
The implementation is the TraceTimeline component.
Preview and fullscreen
The timeline comes in two stages: a timeline preview that shows it in context, and a fullscreen overlay for investigation.
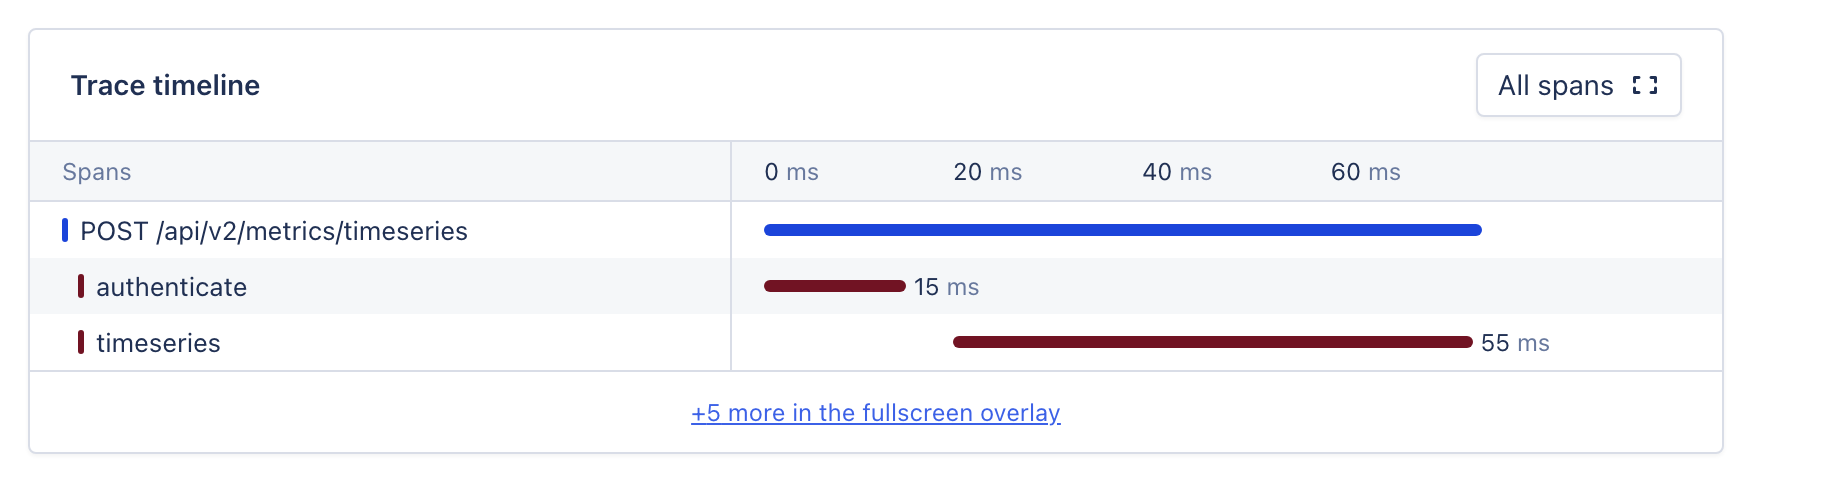
Timeline preview, TraceTimelineBox | Fullscreen overlay, TraceTimelineOverlay | |
|---|---|---|
| Purpose | Summary and preview | Explore, filter and investigate |
| Spans shown | The first 10 spans of the trace | All spans, as the full tree |
| Filters | None | Service, duration, search and breakdown |
| Sidebar | None | Attributes sidebar |
| Row height | 28px | 40px: name and namespace on two lines |
| Entry | Embedded in other views | The preview button, or a click on a span |
The preview hands the rest of the trace to the overlay with a "+N more" link.
Overlay layout
The overlay follows a fixed order from top to bottom. It mirrors the reader's path: choose what to look at, narrow it down, look, then look closer.
- Title: "Trace timeline".
- Toolbar: service, duration and search. These narrow the result set.
- Filter bar: event toggles, and the span-group legend, which is also a filter.
- Body: the timeline table on the left and the attributes sidebar on the right. Both are resizable.
- Footer: an instrumentation link. It is a standing hint for readers whose traces are short on spans.
The spans column and the sidebar can both be resized, and their widths persist across sessions in localStorage.
| Panel | Min | Default | Max | Storage key |
|---|---|---|---|---|
| Spans column | 240 | 460 | 720 | trace-timeline-spans-column-width |
| Attributes sidebar | 320 | 420 | 800 | trace-timeline-attributes-sidebar-width |
Show the resize handles only at the md breakpoint and up, and hide them on narrow screens. A handle turns blue-400 on hover and blue-500 while dragging.
Span row
One row is one span. The left half is identity: the span's position in the tree, and its name. The right half is timing: the bar and the duration.
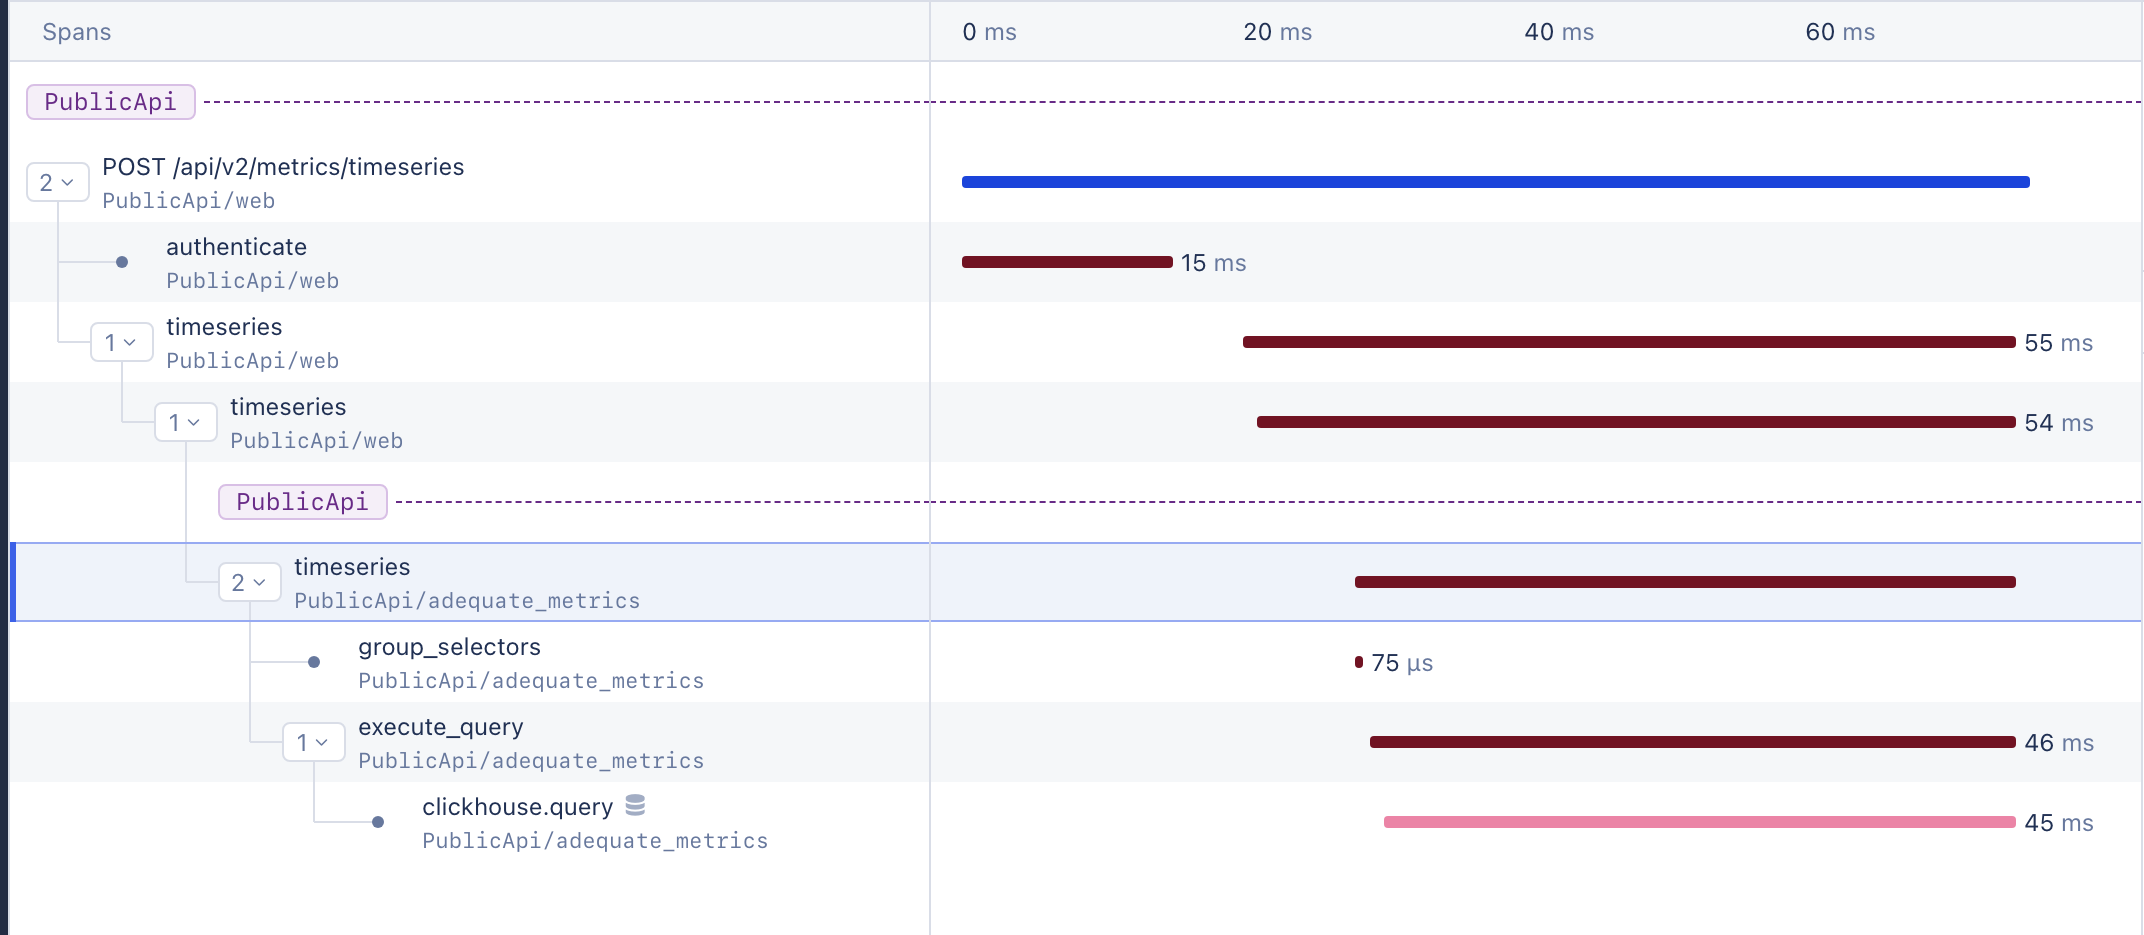
- Tree gutter: one vertical guide per depth. The last child gets an elbow (└). If more siblings follow, the vertical line continues.
- Expand toggle: a span with children shows a child count and a chevron button. A leaf shows a dot.
- Name and namespace: the name on one line, truncated, with the namespace in monospace below it.
- Bar: the left edge is (span start − timeline start) / total, and the width is duration / total, both as percentages. A subtrace root has no duration label, because that time is not its own work.
Always render a duration through FormattedDuration, so the switch between ns, µs, ms and s stays consistent.
Span groups and colour
Bar colour encodes the span's type, its group. The group is resolved in priority order, in spanGroups.js:
- The customer-set
appsignal.groupattribute. - OpenTelemetry semantic attributes:
db.system,messaging.system,rpc.system, orhttp.methodwithspan_kind. - Other.
Each group has its own colour token, from --span-web-server to --span-others. The values are on the semantic colour page.
The breakdown bar reuses this palette as a legend that is also a filter. Toggling a group changes how the bars of that colour appear in the timeline.

Event and issue markers
Extra signals on a span show as small icons only. The detail is in the sidebar, through AttributesPreview.
| Marker | Icon | Meaning |
|---|---|---|
| Error | fa-bug, in the error colour | The span contains an exception event |
| Event | fa-calendar | The span contains an event that is not an exception |
| Query | fa-database | The span contains a database query |
| N+1 | fa-clone | The span is an N+1 duplicate |
A span with an exception is emphasised: its name and bar take the error colour, and when it is selected it gets the error background and border. Errors should be the first thing a reader spots on the timeline. The detail is in the sidebar's exception banner and its Exceptions tab.

Filtering
Filtering has two layers. The toolbar narrows the result set, so spans that do not match disappear. The breakdown bar toggles groups on and off, so spans are emphasised or hidden.
In the breakdown bar:
- EVENTS has Errors, Queries and Events checkboxes. They filter by attribute.
- SPAN GROUP has one coloured checkbox per group. All groups are on by default.
- Hover a group to emphasise it and dim the rest.
- Click a group to toggle it. The last group that is on stays on.
- ⌘-click or Alt-click a group to isolate it. Do it again to select all.
Matches propagate from child to parent. If a child matches and its parent does not, the parent stays in the tree but is dimmed with opacity-25. Matching spans stand out without losing their place in the tree. This is done in nestSpans.
Row states
A row can be in several states at once, so the states have a precedence.
| State | Trigger | Treatment |
|---|---|---|
| Selected | A click. The span is shown in the sidebar | A left accent bar and the surface-highlight background |
| Highlighted | Hover | The surface-highlight background |
| Zebra | Even rows | The surface-raised background |
| Dimmed | A group hover, or a partial match | opacity-25 |
| Exception | The span contains an exception | Error-coloured text and bar, and the error background when selected |
Group emphasis on hover takes precedence over dimming from a partial match. The exception state replaces the selected and highlighted colours with the error colour.
Use the left accent bar for selection, so it is clear which span the sidebar is showing. Keep the hover treatment different, so a passing state never looks like a fixed one.
Moving the pointer across a row shows a vertical cursor guide line. It helps the reader see how bars line up on the time axis.
Attributes sidebar
The sidebar holds the full context of the selected span, or of the hovered one. A hovered span takes precedence over the selected one, so the reader gets a fast preview first.
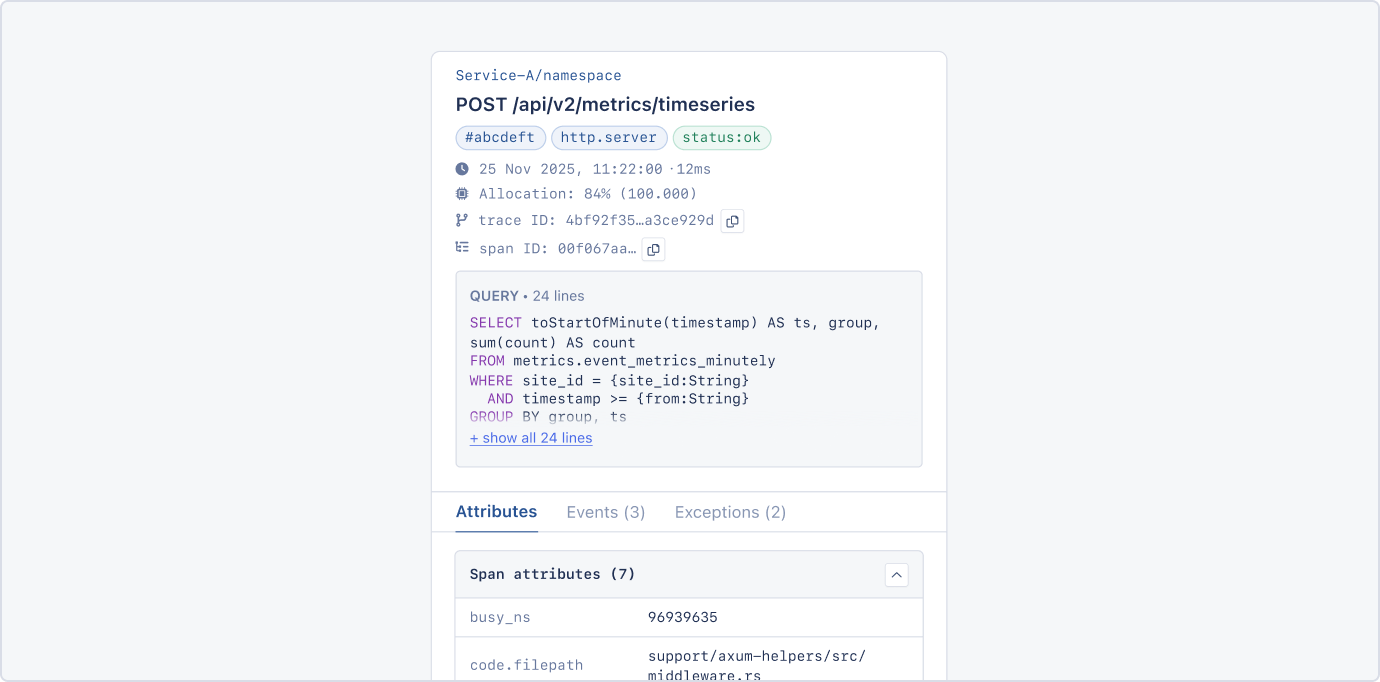
- Header: the namespace, the span name,
span_kindand status badges, the start time and duration, and the memory allocation if there is one. - Trace ID and span ID: directly below the time, each with a copy button.
- Tabs: each label carries a count, such as "Attributes (9)".
- Attribute grid: monospace, with a 144px key column, the value, and a copy action on hover. Search terms are highlighted.
- Internal attributes:
appsignal.*,telemetry.*and raw query keys are hidden by default. "Show internal attributes" reveals them.
Spans with an error
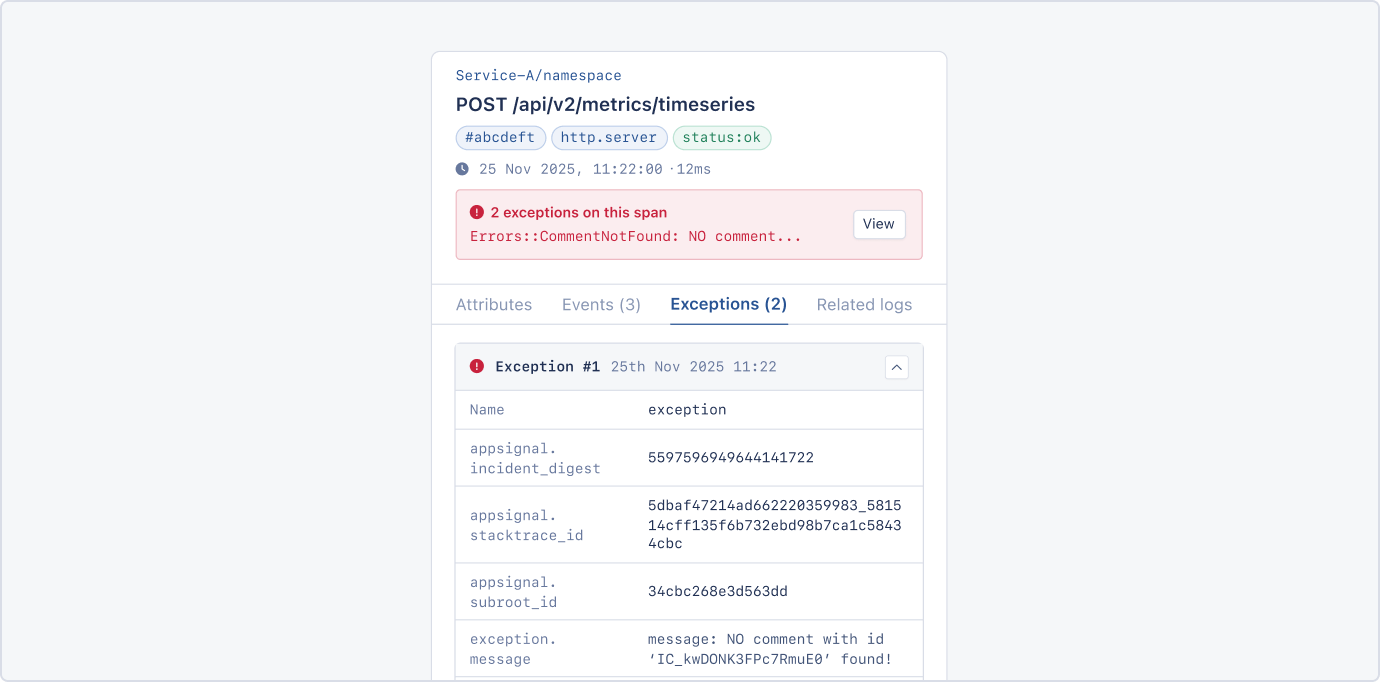
When a span has an exception, the sidebar switches to an error state. It gains a status:error badge, an exception banner with the count, the message and a View button, and an Exceptions tab. This is where an investigation that starts at an error marker in the timeline ends.
Cross-service spans and span links
Where a trace crosses services, boundaries and links are marked consistently in purple.
- Service header: a service-name badge and a dashed line above a subtrace root. It shows that a different service starts here. The
PublicApiheaders in the span row image are examples. - Span links, from OpenTelemetry
links.span_id: attached under the target span with a dashed purple connector. The link row is underlined, carries an external-link icon, and opens the linked trace when clicked. - Within the same trace, keep the span where it is and add a shallow copy under the target.
- Across traces, take the span out of its original position and show it only as a link under the target.
Performance
- Virtual scrolling: the overlay table renders only the visible rows, with
@tanstack/react-virtual, so scrolling stays smooth on traces with thousands of spans. - Axis ticks:
d3.ticks(0, duration, 4)picks about four ticks, labelled withFormattedDuration. - Lazy loading: the overlay is loaded with
lazyandSuspenseonly when it is needed, and shows "Loading timeline…" meanwhile.
N+1 groups
This section documents an in-progress design that is not in the code yet. The right-panel mockups below are recreated from the design screenshots — treat them as intent, not shipped UI.
When the same query repeats many times, an N+1, the timeline collapses the repetitions into one representative span and moves the details to the right panel. A trace with hundreds of duplicate queries stays readable.
The design follows three principles:
- Keep the existing timeline structure, and use the right panel for an N+1 summary.
- Show the slowest, average and fastest span, so the context reads at a glance.
- Use hover states to highlight related spans, so their relationships are easy to see.
Representative span and count badge
- The first occurrence is the representative span. It carries a count badge, such as x99.
- Click the badge to expand the group and show the repeated spans inline in the timeline.
- Hover the badge to highlight every span in the group in blue, so the reader can see where they fall on the timeline.
Today's x8 badge, shown under the Event and issue markers section, is the same pattern at a small scale. The N+1 design adds expanding, hover highlighting and a summary panel.
N+1 summary panel
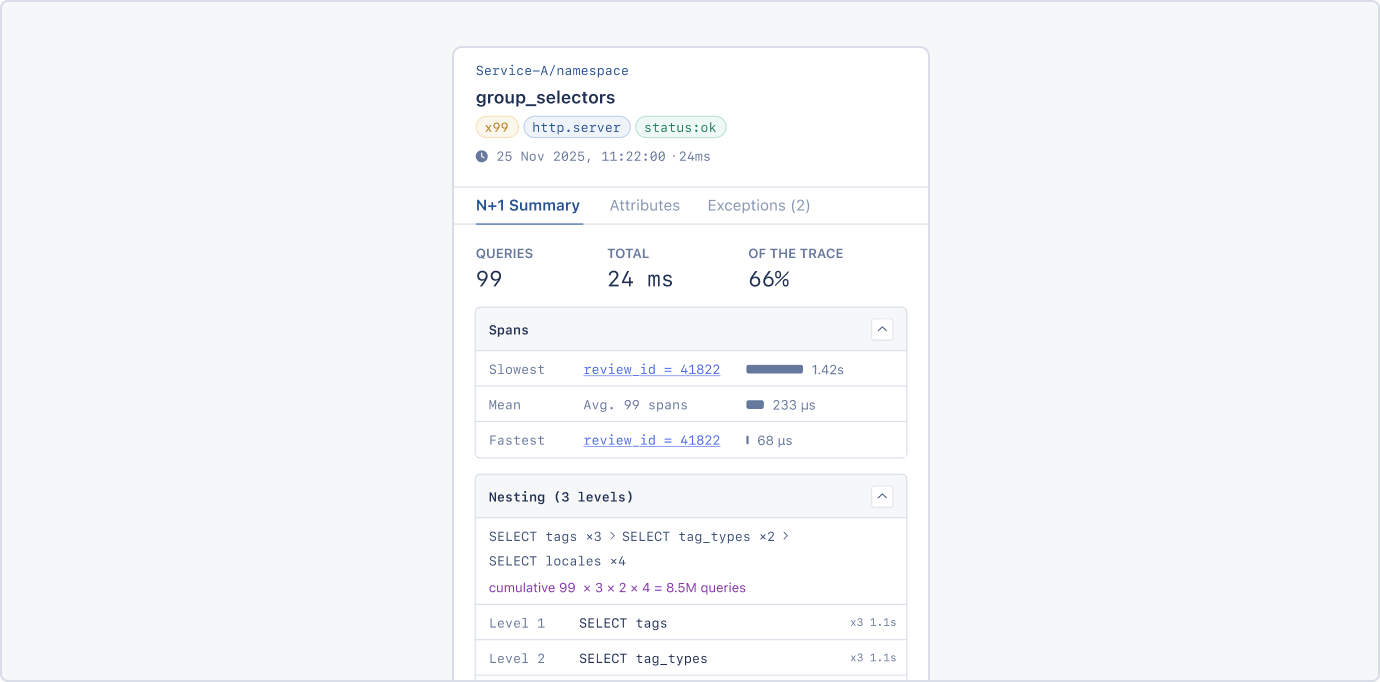
Clicking the representative span opens the N+1 Summary tab. It shows how many queries ran, their total duration, and what percentage of the trace they account for. A Spans card lists the slowest, mean and fastest occurrences. Clicking Slowest or Fastest jumps to that span in the timeline and highlights it.
Nested N+1
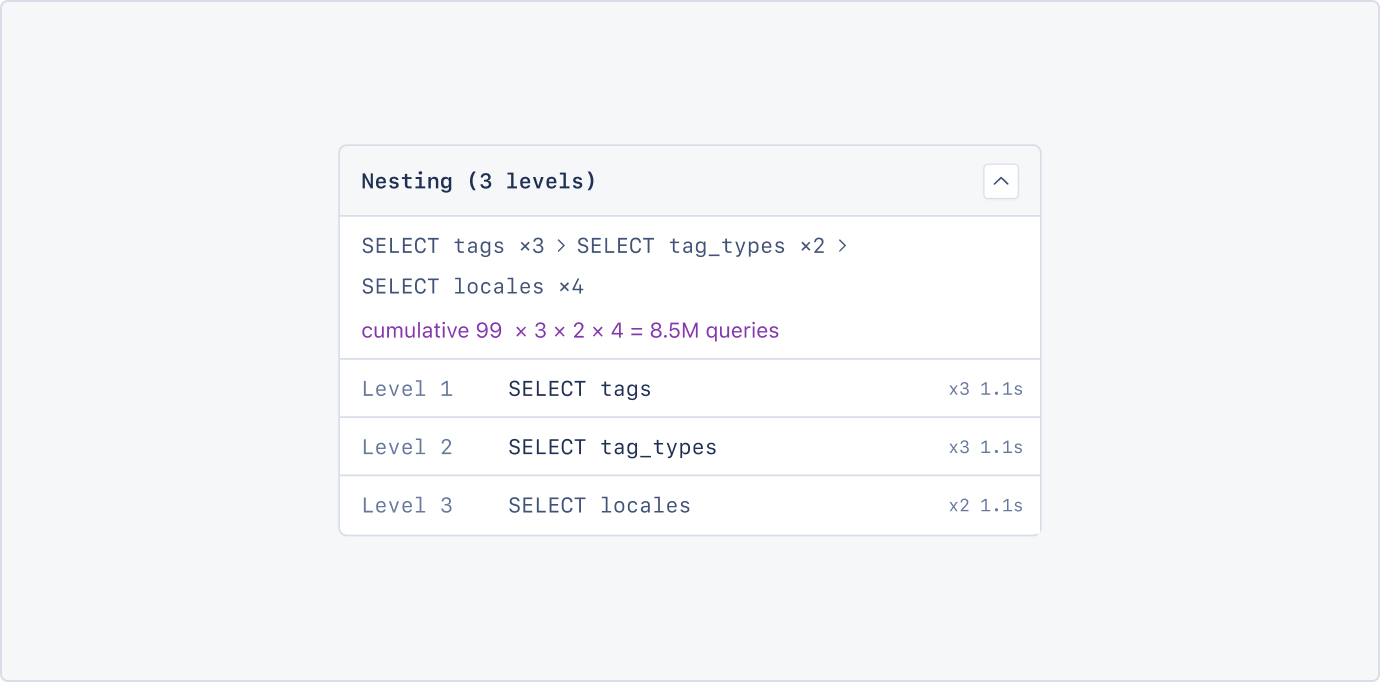
When repetitions are nested, each level shows its own count badge, and the summary adds a Nesting panel. The panel shows the chain of repeated spans, the cumulative multiplication, and a breakdown per level. Clicking the representative span shows the nesting: each span name with its repetition count, and the number of nesting levels.
Working inside an expanded group
After a group is expanded, clicking one of its spans shows that span's attributes like any other span. A "Part of an N+1 group" message stays fixed at the bottom of the panel, with a link back to the summary, so the way back is always available.